The battery percentage on a laptop shows an estimate of its current charge. It does not, by itself, measure battery wear or explain how long your next session will last. Windows also offers usage information that can help put that percentage in context. This article shows how to read the available views and compare ordinary sessions fairly. Brightness, applications, attached equipment and power settings all affect demand. Record those conditions alongside the numbers rather than treating a single chart or percentage as a hardware diagnosis.
Core Battery Metrics and Interpretation
Distinguishing between battery charge and total battery capacity is critical for effective energy management. Battery charge signifies the instantaneous energy available, expressed as a percentage of the currently accessible capacity. Battery capacity, conversely, reflects the total energy potential a battery cell can hold. It is vital to recognize that lithium-ion batteries undergo chemical aging, leading to a natural, irreversible reduction in maximum capacity over time. A device displaying a 100% charge status today likely stores less energy than it did when the hardware was brand new.
The Power & Battery settings interface acts as a diagnostic hub, documenting energy expenditure trends. The usage charts enable you to visualize power depletion across varying intervals, from 24-hour windows to weekly aggregates. By analyzing these curves, users can correlate steep discharge rates with specific high-demand activities. For instance, you might notice that running intensive rendering software or utilizing high-refresh-rate display modes induces a markedly accelerated decline in charge. Understanding this data allows for informed decision-making regarding which background applications should be constrained to preserve remaining energy.
Diagnostic Procedures for Power Optimization
This diagnostic workflow enables precise identification of energy-intensive processes and provides steps to apply meaningful consumption limits through the Windows 11 interface. Menu paths may occasionally shift based on specific system versions or manufacturer-applied firmware modifications.
- Press the Windows logo key, then select the Settings icon to open the configuration dashboard.
- Navigate to System, then select Power & battery to access the energy management overview.
- Inspect the Battery usage chart to identify trends in power draw during your normal work hours.
- Scroll to the Battery usage per app section to view a granular list of applications ranked by energy expenditure.
- For applications showing elevated power usage, click the vertical three-dot icon to expose additional options.
- Select Manage background activity if available to open the application-specific energy controls.
- Change the Let this app run in the background setting to Never to restrict unnecessary resource allocation while the app remains out of focus.
- Monitor the taskbar battery icon over several hours to evaluate whether the discharge rate has slowed following your modifications.
Display Boundaries and Power Scaling
The display panel is frequently the most significant source of battery drain on mobile hardware. Lowering screen brightness via the Display settings is the most effective immediate intervention for extending operation time. While systems often include automatic brightness adjustments based on ambient light sensors, this feature can sometimes trigger unnecessary power increases in inconsistent lighting environments; disabling this can maintain a more predictable, lower brightness profile.
Refresh rate configuration represents another vital area for power preservation. High refresh rates, such as 120Hz, enhance motion clarity but require the hardware to process and render frames more often than a standard 60Hz display. By navigating to Advanced display settings and forcing a 60Hz refresh rate, you reduce the graphical workload. This choice is a technical trade-off: you may gain extended operational uptime by sacrificing visual smoothness, but display modes depend on the whole connection, and there is no guaranteed FPS.
Furthermore, on devices equipped with OLED display technology, system-wide dark themes and dark backgrounds offer genuine energy savings. Because each pixel on an OLED panel is an independent light source, reducing the number of illuminated, bright-colored pixels directly curtails the total power required by the display. Although LCD panels do not experience the same degree of efficiency gain from dark themes, the reduction in backlight intensity required when using high-contrast, dark-mode interfaces can still lead to marginal gains in endurance for long-duration mobile use.
Managing System-Wide Power Envelopes
The Power mode setting functions as a master controller for system performance, governing how the processor and associated hardware components operate within their thermal and electrical envelopes. Selecting 'Best power efficiency' instructs the operating system to aggressively prioritize lower power consumption by capping the CPU's peak frequency and restricting high-performance boosts. This mode limits the system's overall power throughput, effectively smoothing out energy consumption spikes.
Users should be aware that the availability of these specific power profiles is often tied to manufacturer-defined firmware. If the Power mode option is absent from your Power & battery settings, it suggests that your specific hardware either lacks the necessary reporting hooks or the manufacturer has opted to handle power state transitions exclusively through proprietary firmware or system utilities. In such cases, one must rely on secondary optimizations like background task management or reducing display-related energy consumption to achieve similar goals.
Background data synchronization represents another common source of 'invisible' battery depletion. Frequent background network activity—driven by mail clients, news tickers, or calendar syncing—keeps the wireless networking module in a constant active state and prevents the CPU from entering low-power sleep modes. By adjusting these accounts to sync at longer, predefined intervals (e.g., every two hours) or moving to manual sync settings, you force the device to cluster network requests. This ensures the radio module remains powered down for the majority of your workday, dramatically preserving battery life during extended periods of mobile use.
Practical Examples of Energy Management
Consider a scenario involving web browsing habits. Testing demonstrates that the choice of browser engine heavily influences power consumption. A browser that restricts background tabs and manages idle resource usage can provide a 40% increase in battery life compared to browsers that allow dozens of processes to remain active in the background. If you habitually leave many tabs open, opting for a performance-conscious browser or explicitly limiting tab activity while on battery power can drastically alter your runtime expectations.
Another practical example involves managing video playback. By accessing Video playback settings, users can select 'Optimize for battery life,' which instructs the system to reduce the video's decode resolution when running on battery. This significantly reduces the processing load on both the GPU and the CPU. Combining this with lower screen brightness and a restricted refresh rate allows for long-duration media consumption that would otherwise deplete a full charge in short order. These adjustments collectively demonstrate that optimizing a device is not about one singular setting, but rather the cumulative effect of small, calculated limitations applied across multiple system layers.
Navigating Misleading Energy Data and Comparison Pitfalls
Users frequently misinterpret the battery usage list by assuming that higher percentage values correlate directly to system degradation. High consumption by a specific process often reflects normal intensive workload demands, such as video rendering or compilation tasks, rather than malfunctioning software. Comparing your device's discharge metrics to those of peers is another common pitfall. Discrepancies often arise from hardware variations, including differing panel technologies, processor generations, and storage drive types, which fundamentally alter baseline energy requirements for identical operating systems.
Relying solely on software-reported consumption metrics can lead to inaccurate conclusions about overall hardware efficiency. Because background operating system tasks and telemetry services fluctuate based on network state and idle duration, singular data points are insufficient for judging performance. Instead of viewing daily variance as a sign of failure, monitor trends over multi-day periods to identify genuine anomalies. Always differentiate between consistent high-power usage by a specific application and transient spikes caused by temporary data indexing or cloud synchronization events.
Safe Observation and Hardware Maintenance Protocols
Observing physical changes in a battery pack, such as chassis bulging or localized heat concentration during charging, warrants immediate cessation of use. Avoid placing your laptop on soft surfaces like blankets or pillows while under load, as this traps thermal energy and accelerates the chemical degradation of internal cells. Maintaining a stable ambient temperature is the most effective passive strategy for preserving long-term capacity. Excessive heat forces the charging management system to limit energy intake, which prolongs charge duration and potentially leads to premature hardware wear.
While evaluating power drain, ensure your observations occur under repeatable conditions to maintain data integrity. Comparing power profiles while wireless radios are active versus in airplane mode isolates the radio module's contribution to depletion. Likewise, verify that no external peripherals, such as USB-C docks, external drives, or high-draw mice, are attached during your assessment, as these frequently contribute hidden energy loads. Isolating your device from these accessories allows for a clean measurement of how the system manages power under its own internal load.
Compare like-for-like sessions
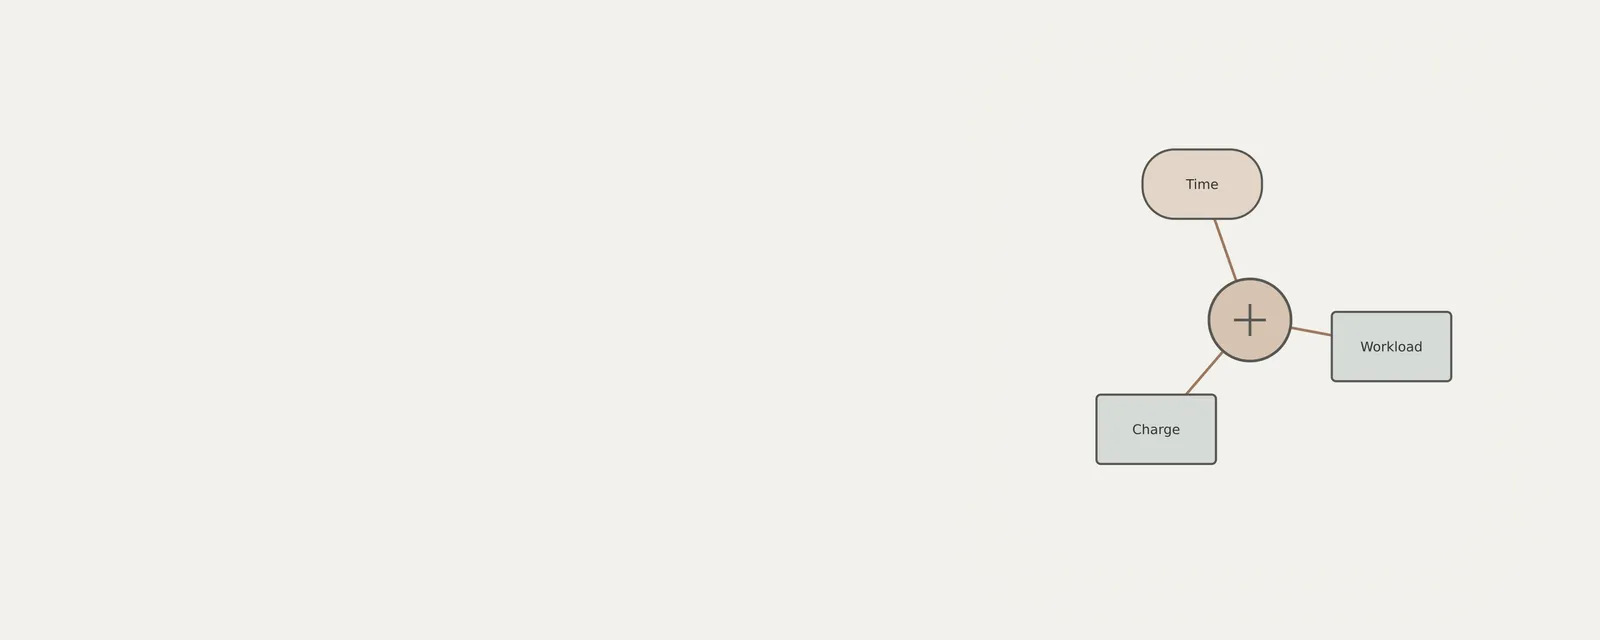
For a useful comparison, note the charge percentage at the start and end of two ordinary sessions of similar length. Keep the workload reasonably similar: reading documents is not equivalent to playing video while using an external screen. A different percentage change does not establish a fault. Background tasks, wireless activity and room conditions can all affect demand, so treat the notes as context rather than a battery-health measurement.
Laptops
Note these before you change anything
Useful facts to have to hand while reading about reading laptop battery usage.
- Exact model and variant code from the underside label
- Firmware version
- The maker's driver package versions
- Which functions fail: hotkeys, touchpad gestures, sleep
Laptops: Selected laptop-specific layers
- Operating systempower and input
- Platform drivershotkeys, sensors, power
- Embedded controllerbattery and fans
- Integrated devicestouchpad, camera, keyboard
- Docks and portsUSB-C and similar
Frequently asked questions
Is current charge the same as battery health?
No. Charge estimates how much energy is available relative to the battery’s current full-charge estimate. Battery condition concerns capacity and behavior over time. A single percentage or ordinary usage chart does not establish wear, remaining lifespan or whether the battery needs to be replaced.
Why do similar sessions use different amounts of charge?
The sessions may differ in brightness, wireless activity, background work, temperature or attached equipment. Even the same application can do different work between observations. Keep brief notes about the conditions and compare several ordinary sessions rather than attributing one difference to a particular component.
Should I deliberately drain the battery for this exercise?
No. The observation steps do not require an empty battery or repeated deep discharges. Read the information during ordinary use and follow the computer manufacturer’s charging guidance. Stop using equipment that shows a physical safety concern instead of continuing an experiment to collect more numbers.